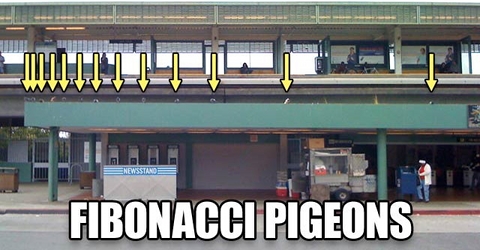
Fibonacci Pigeons
Dal sito mathblag.wordpress.com
Here is a funny picture that has been circulating the Internet since September 2010. I think that analyzing this picture would be an interesting project for a high school math class. My own analysis is included below.

This picture is amusing, but I wondered if it was real. Some people claim that the picture was Photoshopped. I don’t know how to tell if it was faked, but I do know how to count pixels.
I copied the picture into Microsoft Paint, and I recorded the x-coordinates of the arrow tips. Magnifying the picture to 800% made this task much easier. I entered these coordinates into Microsoft Excel, and I also calculated the first differences.

If the pigeons are truly spaced according to the Fibonacci numbers, then the first differences should be roughly proportional to 1.618x. To test this hypothesis, I made a scatter plot, and I fitted an exponential trend line to the data.

The fit is good, but not spectacular (R2 = 0.9357). However, the base of exponents is not even close to 1.618. According to Excel, the exponential function of best fit is y = 5.9093 * exp(0.2453*x), which can also be written as y = 5.9093 * 1.278^x. If we omit the last two data points as outliers, then the correlation improves to R2 = 0.986, but the base of exponents is even smaller (b = 1.216). The spacing between pigeons is simply not increasing as rapidly as the Fibonacci numbers.
Conclusion: the picture is funny, and perhaps one should not over-analyze a good joke, but it does not show any evidence that pigeons arrange themselves according to the Fibonacci numbers.